Nigel Goldenfeld's Group: Turbulence
Nigel Goldenfeld's Group: Turbulence |
||
|
|
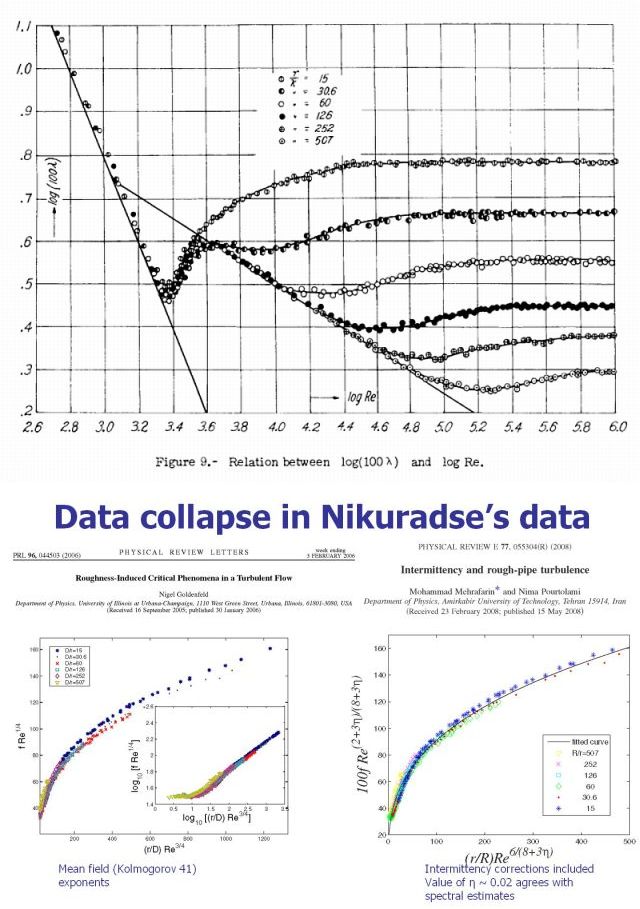
Why study turbulence? Turbulence is the generic state of flow of sufficiently rapidly-moving fluids, an ever-changing dynamically-unstable pattern that involves motion at many scales. It is familiar in everyday life, and its effects govern the speed of rivers, the drag force experienced by a car, and the flow of blood in our hearts. Despite its importance, it is still not well-understood: for example, even to this day, it is not known how to predict accurately the pressure needed to force a fluid (such as gas) through a pipeline at a desired rate. How is turbulence studied? Because the flow pattern always changes, the best we can do is understand its statistical properties. Because the swirling eddy patterns of turbulence look the same at many different length scales, to a good approximation, our statistical description will be very complex. Much theoretical work focuses on an ideal state with convenient symmetry, in which the flow looks the same statistically in all directions, there is no net flow, and the boundaries are removed. The real world is rather different. In the example of pipe flow, there is a mean flow superimposed on the fluctuating state, and the pipe has walls. It is possible to make accurate measurements of flow properties over a wide enough range of fluid speeds and pipe dimensions that scientifically-strong conclusions can be drawn. A definitive set of experiments were performed by J. Nikuradse in 1932-3, and these have remained the benchmark in the field despite subsequent technical advances. What is different about our approach to turbulence? Our perspective is that symmetry is the enemy of instability, and that to understand the intrinsic properties of turbulence, it is necessary to consider realistic flows, ones where there are experimental data covering a wide range of flow conditions. In pipe flows, there are imperfections: the pipe walls are not perfectly smooth, and so the flows are not ideal. Our work has shown that although it is tempting to ignore such blemishes and seek an aesthetically-pure mathematical description, this leaves out the fundamental role of the boundaries in assisting the flow irregularities that constitute turbulence. What have we discovered about turbulence? Our work, and ongoing work in collaboration with Gustavo Gioia, Pinaki Chakraborty, Nicholas Guttenberg and others, has unveiled a close connection between the friction experienced by the fluid in moving through a pipe (basically, the pressure drop along the pipe needed to make the turbulent fluid flow through it) and the statistical properties of the fluctuations. This is surprising, because the friction is measured at the large scale of the whole pipe, but the fluctuations are observed on microscopic scales. Gioia and Chakraborty showed how the main features of Nikuradse's data could be explained from this connection. Our work has shown that turbulence can be analyzed using techniques that were first successfully used to solve the problem of phase transitions, and this reveals an underlying simplicity in the data that had not previously been noticed: changing the roughness of the walls corresponds to a change in the flow speed of the turbulence in a very specific way. In the figure below, Nikuradse's data for the friction are plotted as a function of the flow speed (more precisely,the Reynolds number) and the pipe roughness. The rougher the wall, the greater the friction. Yet, when plotted as our theory predicts, the data fall onto one universal curve, enabling details of the small-scale velocity fluctuations to be extracted. Turbulence in two dimensions - a strong test of our theory. We have very recently extended our work to study turbulent flows in two dimensions, as can be created in the laboratory using soap films. We do this because the statistical properties of the swirling eddies of turbulence are quite different from those in three dimensions. In particular, it turns out that there are two distinct kinds of flow fluctuation, because both rotational motions and energy can range over many length-scales. Our theory predicts that the friction depends upon which of the two kinds of flow fluctuation is present in the experiment, and we have confirmed this prediction by computer simulations. Work is in progress to verify these predictions in real experiments being carried out in collaboration with Walter Goldburg at the University of Pittsburgh. The textbook theory of turbulence does not have a way to represent the nature of the turbulent state, i.e. which kind of turbulent flow is present, and so it cannot make the same predictions as our work, nor can it explain our experimental results. Who cares? Physicists and engineers do, because our approach is quite different from the textbook approach to turbulence. We ask a new question: how can we connect the small scale fluctuations in the turbulent fluid to the large-scale effects of turbulent drag? By asking a new sort of question, we were able to make a fundamental advance on a problem that has been mysterious for the best part of a century. In contrast to the new work of our group at Illinois, the standard approach to turbulent boundary layers, going back to the 1920's was not able to predict: (1) the quantitative details of the friction factor curves in three-dimensional pipes, such as the way in which the friction varied with pipe-roughness; (2) the overall shape of the friction factor curves, with the "spoon" profile; (3) the data collapse and the connection with small-scale fluctuation properties; (4) the way in which the friction depends on the nature of the flow state in two-dimensional turbulence. Our new understanding can be used to predict how to transport oil and gas through long pipelines at lower energy cost, by adding polymer molecules to the fluid to make it flow with less drag. FIGURES BELOW Top: From Nikuradse's original measurements on the friction experienced by a turbulent fluid flowing through a pipe is shown the graph of the friction factor (y-axis) vs. the Reynolds number (x-axis). The friction factor is related to the actual friction as measured, but has been divided by the square of the average speed of the flow. The Reynolds number can be thought of as the average flow speed. These data are shown for pipes with sand grains glued to the walls of the pipe, thus creating roughness. The detailed mathematical aspects of these curves was first accounted for in the theory of Gioia and Chakraborty. Bottom: Goldenfeld's work proposes that the features of turbulence can be understood as arising from a singularity at infinite Reynolds number and zero roughness. Such singularities are known to arise in other physics problems, especially phase transitions, such as that which occurs when iron is cooled down below the Curie temperature and becomes magnetic. The theory predicts that the small scale fluctuations in the fluid speed, a characteristic of turbulence, are connected to the friction, and this can be demonstrated by plotting the data in a special way that causes all of the Nikuradse curves at different roughness to collapse onto a single curve. Goldenfeld's work was extended by Mehrafahrin and Pourtolami who used Nikuradse's 1933 large-scale friction data to extract the subtle characteristics of the small-scale turbulent velocity fluctuations. These subtle characteristics describe the intermittency of turbulence --- the fact that turbulence arises in sudden large bursts, one after the other, followed by a period of relative quiescence. If you have ever flown in an airplane, you probably noticed this for yourself!
|
![]()